DALLAS — Read this story and more North Texas business news from our partners at the Dallas Business Journal
So much of the growth story in Texas, including Dallas-Fort Worth, is about the suburbs.
That was reinforced last week when the U.S. Census Bureau released its latest population estimates for metro areas and counties. The Dallas-Fort Worth metro added an estimated 152,598 people from mid-2022 to mid-2023, the largest raw increase in the nation, Dallas Business Journal's Plamedie Ifasso reported.
But Dallas County actually saw negative net domestic migration, according to the agency's estimates, accelerating a trend seen the year prior. Its overall population increased, thanks to births outpacing deaths.
That begged for further exploration of where the DFW metro is actually growing. Kaufman County and Rockwall County — both on the east side of the Metroplex — ranked No. 1 and No. 2 in the state with estimated population increases of 7.6% and 6.5%, respectively, according to a Dallas Business Journal analysis of the Census Bureau data. You can see the full list below.
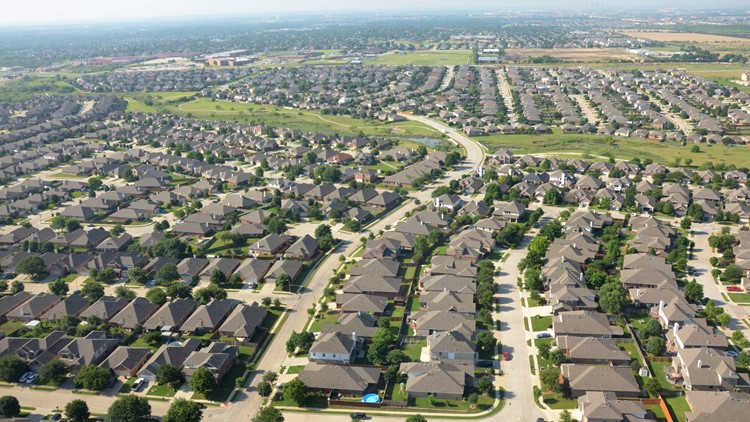
This growth has major ramifications for business and government. Homebuilders and retailers need to know where people are headed, while school district leaders and city planners must prepare for how growth will impact the groups they serve. Huge neighborhoods continue to spring up on DFW's urban periphery, which is creating new business opportunities, as well as challenges around infrastructure.
Here are the top 10:
Kaufman County: 172,611 in 2022 vs. 185,690 in 2023 (7.6%)
Rockwall County: 123,342 in 2022 vs. 131,307 in 2023 (6.5%)
Liberty County: 102,462 in 2022 vs. 108,272 in 2023 (5.7%)
Blanco County: 12,411 in 2022 vs. 13,048 in 2023 (5.1%)
Chambers County: 51,309 in 2022 vs. 53,876 in 2023 (5.0%)
Comal County: 184,749 in 2022 vs. 193,928 in 2023 (5.0%)
Ellis County: 212,323 in 2022 vs. 222,829 in 2023 (4.9%)
Montgomery County: 679,554 in 2022 vs. 711,354 in 2023 (4.7%)
Parker County: 165,938 in 2022 vs. 173,494 in 2023 (4.6%)
Hunt County: 108,438 in 2022 vs. 113,347 in 2023 (4.6%)