I’m letting you know now, right here in the first sentence of this article, that there is a middle section that gets extremely numbers-y. I invented stats like “+/-RS/9tm” and “Pace/BF”. You can skip that middle section if you hate hearing people nerd on about stats, but if that’s the case, you might want to just skip the rest of this article altogether, click on the big red banner up there, and mindlessly watch a giraffe continue to not give birth. To everyone else: welcome!
I don’t often get this deep into statistical analysis, but once in awhile, I’ll stumble upon a question that requires me to dust off the ol’ star trek shirt and set to spreadsheetin’. Last week, one such question arose (again): Why can't the Rangers seem to score when Yu Darvish only gives up one run?
THE QUESTION
In the first inning of A.J. Griffin’s start on April 7th, the first three A’s to come to the plate hit the ball hard to center field. Carlos Gomez caught all three of the projectiles, including one that was en route to the Rangers bullpen. When Gomez returned to the dugout, the team greeted him at the top step. In the bottom of the inning, Gomez–who later admitted he was still pumped up and breathing hard from the top half of the inning–led off with a bloop single that he stretched into a double. The tone was set: the Rangers scored 3 runs in the first inning, and went on to win 10-5.
The next night, Yu Darvish allowed a mere one run over 6 innings. The Rangers scored no runs for him, ultimately losing the game 6-1. I looked it up: in games where Darvish has allowed exactly one run, the Rangers are a disappointing 10-8. Why, I wondered, did A.J. Griffin seem to get so much run support, and Yu Darvish seem to get so little? Suddenly, the proverbial light bulb appeared: Griffin is consistently one of the fastest workers in the game. Darvish is consistently one of the slowest.
I also remembered Jeff Banister mentioning many times since I started covering the team that he wanted to give (Prince Fielder / Carlos Beltran / Shin Soo Choo) a couple games a week in the field, “just to keep him engaged.” Griffin pitches to contact, Darvish pitches to strike hitters out. I made a mental note to check on this too. The grander question began to take shape:
Can a starting pitcher do anything at all to influence the amount of run support he gets?
It made sense to me (at least more sense than the oft-repeated “the batters know [Ace Pitcher] is going to shut the other team down, so they take a day off” axiom). if it were any time before 2007, I could confidently tell you that it was some combination of pace and pitching to contact, and no one could empirically prove me wrong or right.
Fortunately for me, as Rangers radio broadcaster Eric Nadel was so kind to point out, FanGraphs keeps track of pitcher pace, and has done so since the 2007 season. That meant I had ten seasons of data to play with. I asked Kate Morrison, who knows a lot more about advanced stats than I do, if ten years was enough data. “It’s a good size, yes,” she assured me. I rolled up my sensible sleeves and dove Scrooge McDuck-style into a shiny vat of numbers.
ASSEMBLING THE DATA
(This is the part you can skip if you want)
A. GET ALLLLL THE DATA
First, I downloaded the numbers from the last ten full seasons of starting pitching from Fangraphs. If you want to look this up yourself, It’s found under the pitching leaders under “plate discipline”, and you can add the “pace” tab yourself to make a custom table.*
At first, I only downloaded stats from starters who had pitched the “qualifying” 162 innings or more in a season, but I quickly realized that if I wanted to compare a single pitcher against the field (all other pitchers), the bigger field would yield much more data. So I added every pitcher who had made a start for any MLB team between 2007-2016. Well, almost. For reasons I will explain in the next paragraph, I had to delete every pitcher who was traded or played for more than one team in any particular season.
B. DECIDE ON PARAMETERS
Why did I delete pitchers who had been traded? I wanted to make sure the comparisons were fair. I couldn’t exactly compare Felix Hernandez’ run support from the 2010 Mariners (who scored a measly 513 runs for the entire season) to C.C. Sabathia's support from the ‘09 Yankees (939 team runs) and pretend to be doing science. Not only did I want to compare apples to apples, I wanted to compare apples to apples from the same tree in the same orchard in the same year. That meant eliminating pitchers who were not anchored to one team in a given season.
Next, I embarked on the time-consuming task of creating a +/- Run Support per 9 ratio (+/-RS/9tm). I added up the total number of runs scored for each starter on any given team/year. Here are the 2015 Texas Rangers as an example:
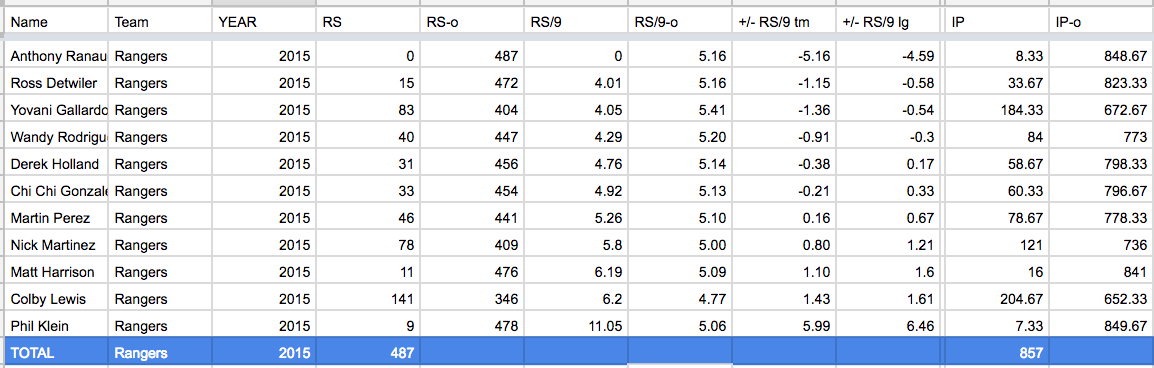
That year’s Rangers team scored 487 runs while these 11 starters were in the game. Once a reliever came in, this particular counter stopped and the runs were assigned to the incoming reliever. In the RS-o column, I programmed it to subtract the runs scored for that pitcher from the total of 487 to tell us how much run support the team gave Not-That-Pitcher. I did the same thing for innings pitched (how many starting-pitcher-innings did Not-Colby-Lewis throw in 2015? Now we know: IP-o = 653⅓.
Next up: ((Runs-o / IP-o)*9) = RS/9-o <- That number is the run support that each team gave every other starting pitcher combined. Now that I was comparing very specific apples to apples, I could compare the two to see if a pitcher got more or less run support than his teammates in any given season.
Also, just because I could, I did the same bulk IP / RS calculation for each of the ten years, and compared how each pitcher did compared to the rest of the league. Thus, it was possible for a pitcher (Chi Chi Gonzalez in 2015) to get .21 RS/9 less than his teammates, but .33 RS/9 more than the league.
There was one more thing I needed to do: Pace was one thing, but it didn’t seem specific enough. What if a pitcher worked slowly, but pitched to a lot of contact? What if a pitcher worked quickly, but nibbled a lot and had more extended at-bats, or–as is the case with Darvish–more at bats that resulted in walks or strikeouts than usual? So I invented one more statistic: Pace/batter.
I divided the total number of pitches thrown by the total number of batters faced. Then I multiplied that number by pace to give me an average pace per batter. This worked out to be a very aesthetically pleasing number, as most pitchers landed somewhere between 70-100, with a rare few sneaking into the 60s and 100s.
After I had all this data compiled, arranged, and populated, my computer was working at a snail’s pace. So I copied the whole spreadsheet and pasted it into a new one where only the values (not the equations) were present. This also allowed me, now that I had used all their data, to delete all the non-qualifying (fewer than 162 IP/season) pitchers without messing up all the equations.
I was left with 760 starting pitcher seasons of data from 10 years of 30 teams-- 300 seasons of data!! Alright, let’s move on to phase three:
FIND THE CORRELATIONS!
There were none.
No, really. None.
Google sheets has a correlation tool. +1.00 is a 100% correlation, and -1.00 is a 100% negative correlation. The correlation between run support differential between a pitcher and his teammates (+/-RS/9tm) and Pace/Batter? -0.009. Less than a 1% correlation, and negative, at that.
I decided, while I had the data, to check a few other things. Was there correlation between +/-RS/9tm and a combined K/BB ratio? -.02
What about pitches per batter? -.01.
I looked at the top three fastest Pace/Batter seasons ever. They all belonged to Mark Buehrle (the fastest, in 2015: 54.39, with a pace of 15.9). In those three seasons, his +/-RS/9tms were +1.03, -0.56, and -0.02
The three slowest? Erik Bedard in 2013 with the Astros (106.30, -0.04), Josh Beckett in 2008 with the Red Sox (105.00, -2.07), and Jorge De La Rosa in ‘14 with the Rockies (103.83, +1.46). The latter two were both outside the realm of the norm, but in opposite directions.
I did find one column that at least gave me a +.05 correlation: the (i presume) randomly-assigned player ID number given to each pitcher by FanGraphs’ database. That’s right: my hypothesis had 1/5th the correlation strength as a random number generator. It’s time to pack it in and admit: the starting pitcher (at least in the American League) has no control whatsoever over the run support afforded him.
As I was sweeping up and turning out the lights on the spreadsheet, I decided to go back to the original reason I’d started this fool’s errand. I checked out Darvish’s +/-RS/9tm. Here it is, by season:
2012: -.32 RS/9
2013: 0.00 (Darvish and Not-Darvish each finished with 4.81 RS/9)
2014: +.31
2015: (DNP, injured)
2016: +.07
In short, Darvish gets almost exactly the same run support as his teammates. It just seems–both anecdotally, and in pointing to that 10-8 record in games in which Darvish only allows one run–to come in spurts, as it did yesterday when the team scored five runs against the Angels while Darvish was in the game.
IN CONCLUSION
It’s very possible that I missed something. I’m new to these deep dives into FanGraphs data. If you’d like to play around with the spreadsheet, I left one for you here. You can copy/paste it into your own and see if you find anything of note.
It was disappointing for my hypothesis to be wrong, especially when I spent about 40 hours on it. But sometimes (for me at least), it’s just as interesting to disprove what feels like a really good idea. That thing I thought? It was definitely wrong. It’s cool to live in a world where this amount of data exists and you can teach yourself things, even if you didn’t solve the problem you set out to solve.
-
*I don’t know for sure precisely how pace is measured. Is it from the moment the ball hits the pitcher’s glove to the moment it leaves his hand? Is it from the time he steps on the rubber? Either way, it’s not that important, as we were only using it for comparative purposes.