
TEXAS, USA — Another election season is coming to a close in Texas.
A few voting ballots are still being counted on Wednesday, but the winners have been projected or called for a majority of key positions, including governor, lieutenant governor and attorney general.
So how many people in the Dallas-Fort Worth area made it to the voting booth? And how has voter turnout changed over the last few years? That's what we wanted to find out.
The Texas Secretary of State website shows the election results for current and previous election from the last 30 years. The WFAA team compared the turnout for the 2022 Midterm Election to numbers we could find from the 2018 Election.
The numbers we found for 2022 were recorded when 99% of all Texas polling locations were reporting their ballots. Of the 5,915 locations that were counted, three of them weren't finished counting.
For the 2018 election, we looked at the turnout based on votes for the U.S. Senate election.
Here are the numbers:
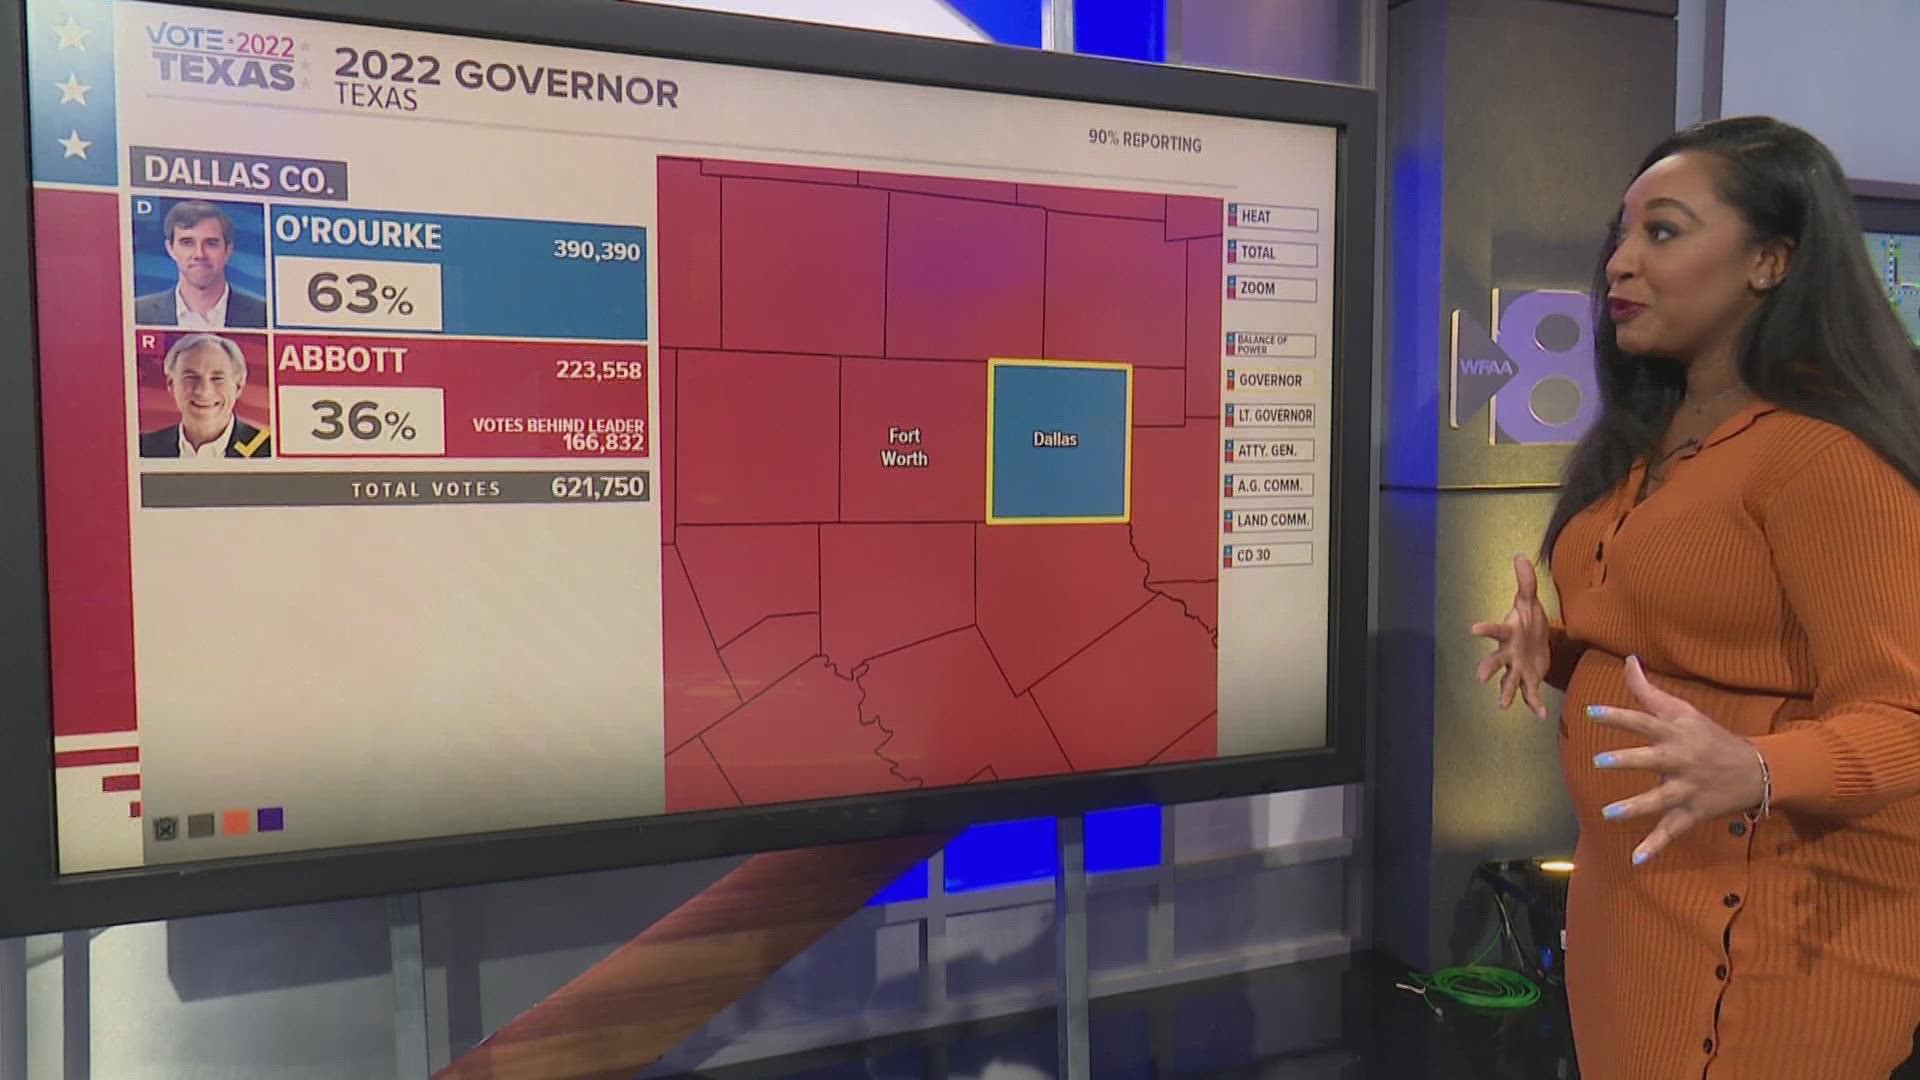
Dallas County
- 2022 - 43.75% voter turnout (1,420,223 registered voters / 621,404 votes)
- 2018 - 54.21% voter turnout (1,335,313 registered voters / 723,897 votes)
Tarrant County
- 2022 - 46.83% voter turnout (1,260,870 registered voters / 590,444 votes)
- 2018 - 55.93% voter turnout (1,122,597 registered voters / 627,894 votes)
Denton County
- 2022 - 52.32% voter turnout (606,275 registered voters / 317,212 votes)
- 2018 - 59.46% voter turnout (497,490 registered voters / 295,802 votes)
Collin County
- 2022 - 52.43% voter turnout (693,753 registered voters / 363,730 votes)
- 2018 - 61.38% voter turnout (579,893 registered voters / 355,966 votes)
Parker County
- 2022 - 54.78% voter turnout (115,621 registered voters / 63,340 votes)
- 2018 - 59.33% voter turnout (91,858 registered voters / 54,495 votes)
Kaufman County
- 2022 - 45.72% voter turnout (93,515 registered voters / 42,755 votes)
- 2018 - 52.87% voter turnout (72,579 registered voters / 38,372 votes)
Ellis County
- 2022 - 51.59% voter turnout (131,057 registered voters / 67,606 votes)
- 2018 - 55.92% voter turnout (108,349 registered voters / 60,589 votes)
Johnson County
- 2022 - 47.74% voter turnout (116,736 registered voters / 55,725 votes)
- 2018 - 53.97% voter turnout (97,157 registered voters / 52,436 votes)
Rockwall County
- 2022 - 54.12% voter turnout (79,059 registered voters / 42,788 votes)
- 2018 - 61.49% voter turnout (62,933 registered voters / 38,699 votes)
Wise County
- 2022 - 51.67% voter turnout (49,888 registered voters / 25,778 votes)
- 2018 - 55.37% voter turnout (41,749 registered voters / 23,117 votes)
Hood County
- 2022 - 55.69% voter turnout (48,651 registered voters / 27,095 votes)
- 2018 - 61.23% voter turnout (40,835 registered voters / 25,005 votes)