Lamar, Palo Pinto and Erath counties currently have the highest positivity rates in North Texas, according to the Texas Department of State Health Services.
The positivity rate is the percentage of total COVID-19 tests conducted that are positive.
In September, Gov. Greg Abbott said a rate above 10% is a "warning flag."
When a county has a higher positivity rate, additional cases aren't solely due to an increase in testing.
The Texas positivity rate, based on specimen collection date, is currently 12%.
Dallas and Tarrant counties have positivity rates above 10%.
All data is based on statistics gathered from the Texas Department of State Health Services.
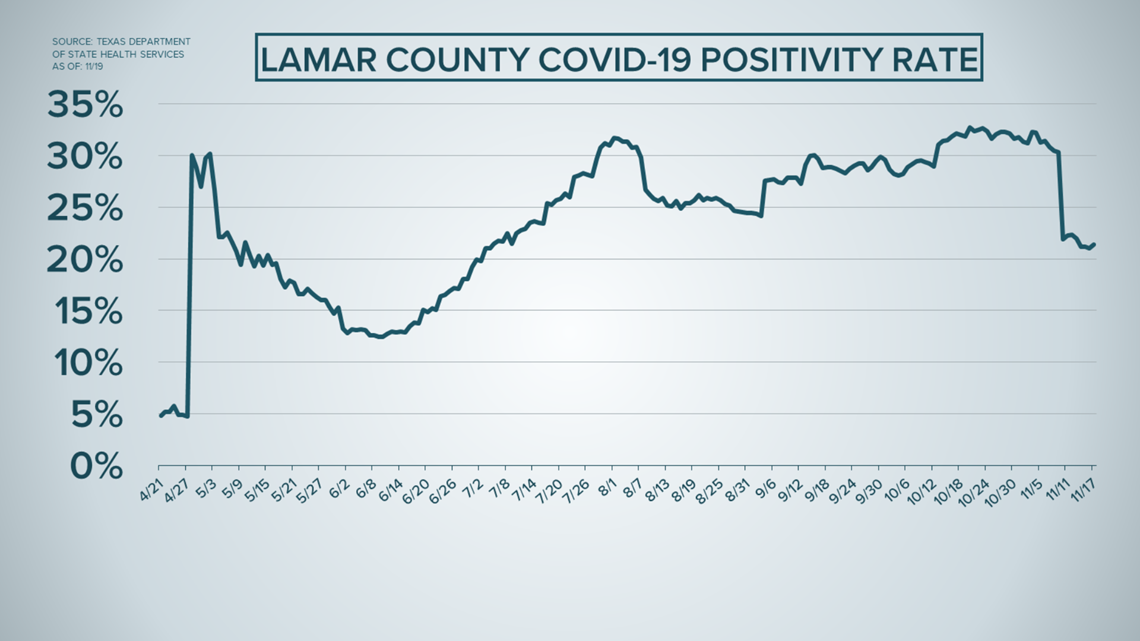
Lamar County
Lamar County currently has a positivity rate of 21%. The record-high happened on Oct. 20 at 33%.
The county's current seven-day average positivity rate is 22%. The record happened from Oct. 18–24 when the average was 32%.

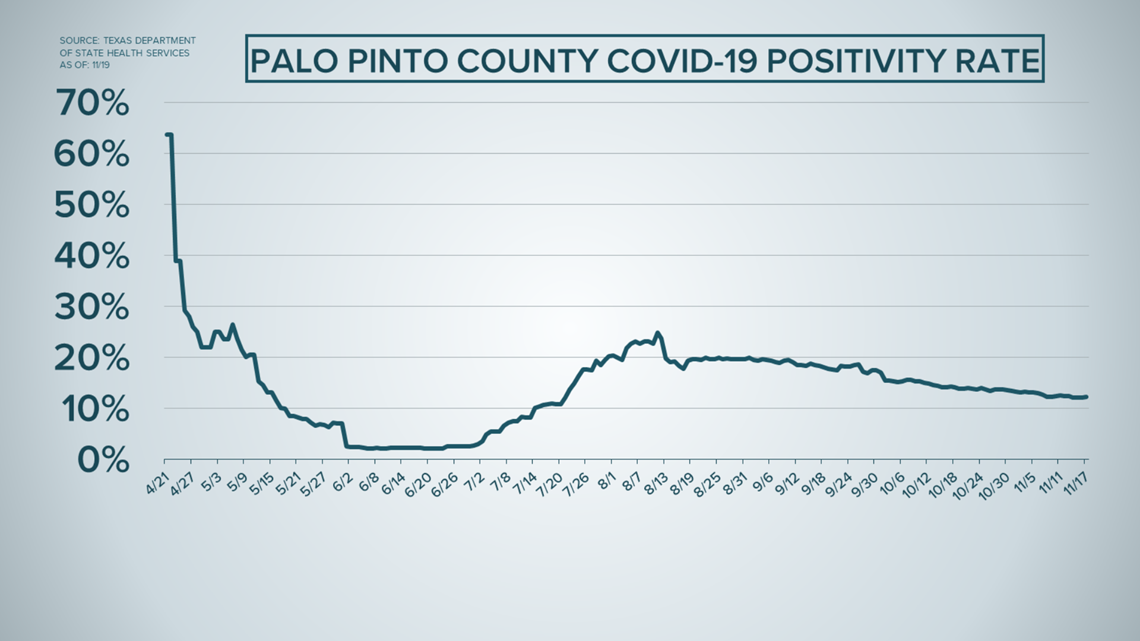
Palo Pinto County
Palo Pinto County currently has a positivity rate of 12%. The record-high happened on April 21 and April 22 at 64%.
The county's current seven-day average positivity rate is 12%. The record happened from April 21–27 when the average was 41%.

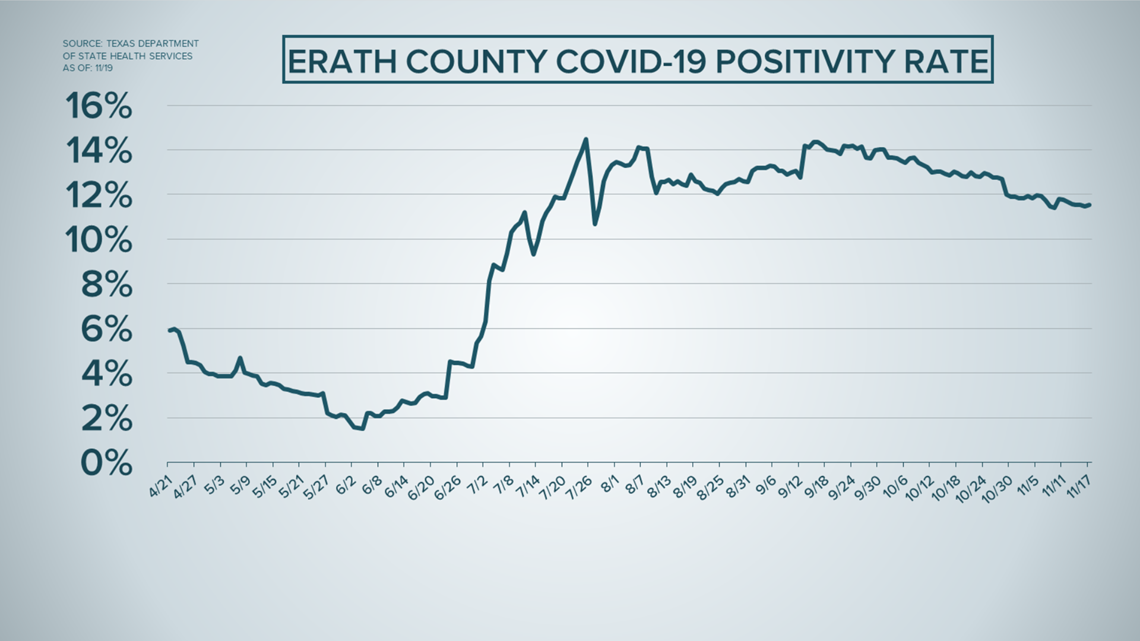
Erath County
Erath County currently has a positivity rate of 12%. The record-high happened on July 25 at 15%.
The county's current seven-day average positivity rate is 12%. The record happened from Sept. 13–19 when the average was 14%.

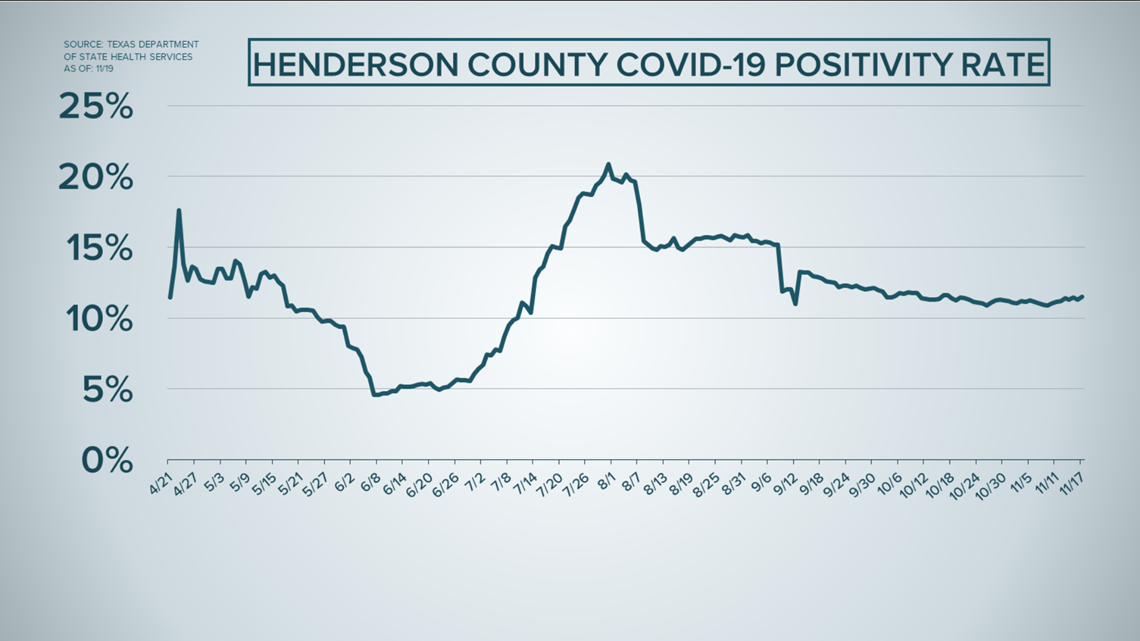
Henderson County
Henderson County currently has a positivity rate of 12%. The record-high happened on July 31 at 21%.
The county's current seven-day average positivity rate is 11%. The record happened from July 30 to Aug 5 when the average was 20%.

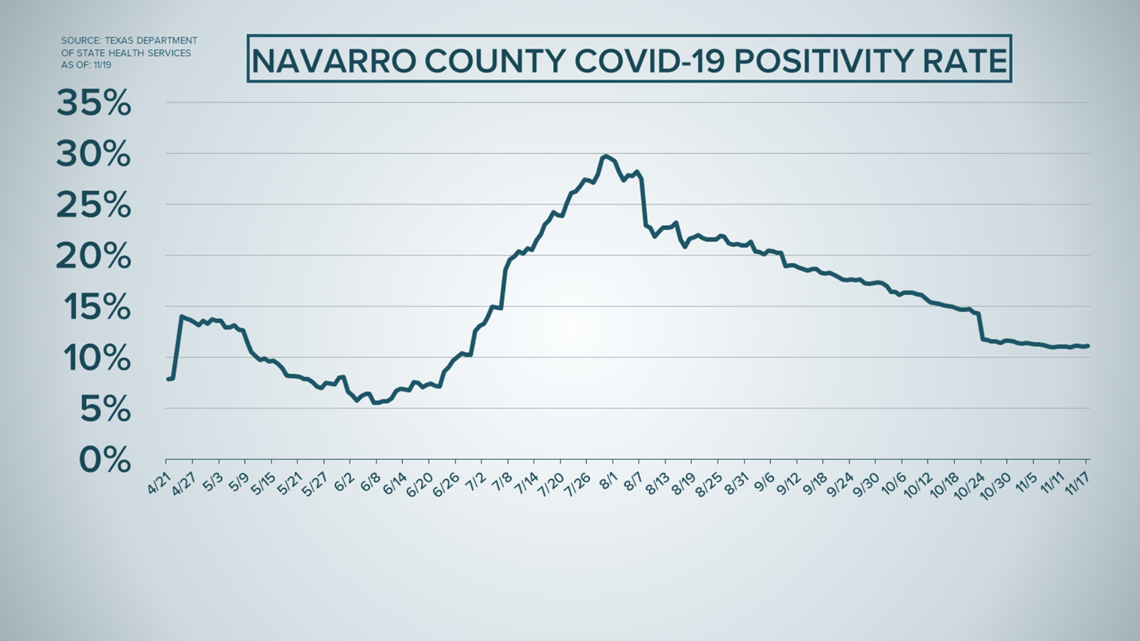
Navarro County
Navarro County currently has a positivity rate of 11%. The record-high happened on July 30 at 30%.
The county's current seven-day average positivity rate is 11%. The record happened from July 28 to Aug. 3 when the average was 29%.

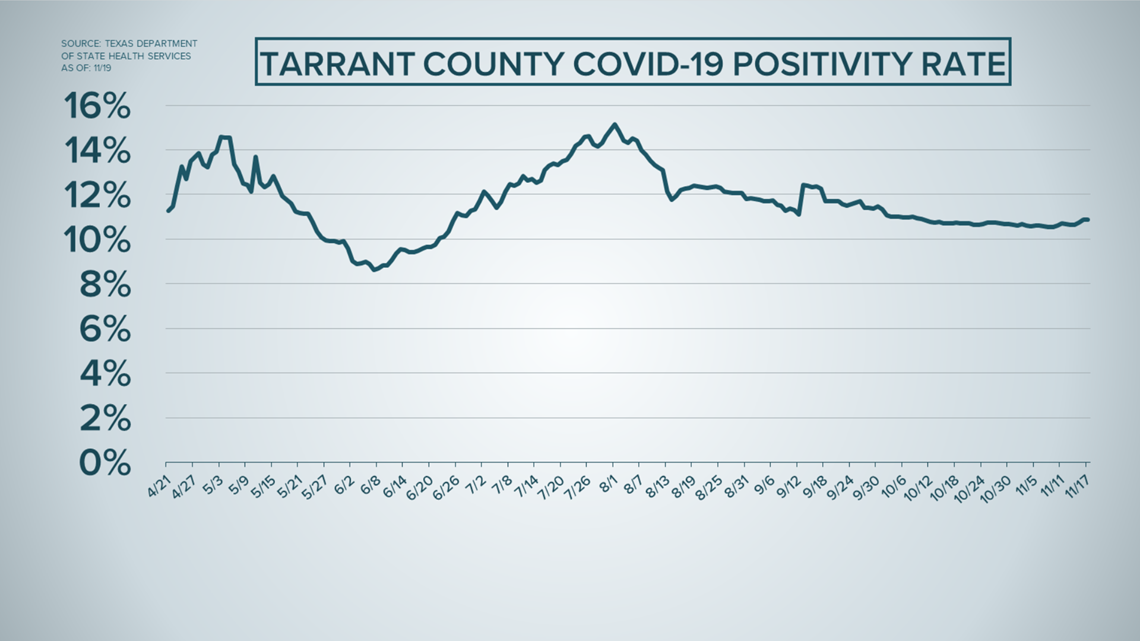
Tarrant County
Tarrant County currently has a positivity rate of 11%. The record-high happened on Aug. 1 at 15%.
The county's current seven-day average positivity rate is 11%. The record happened from July 30 to Aug. 5 when the average was 15%.

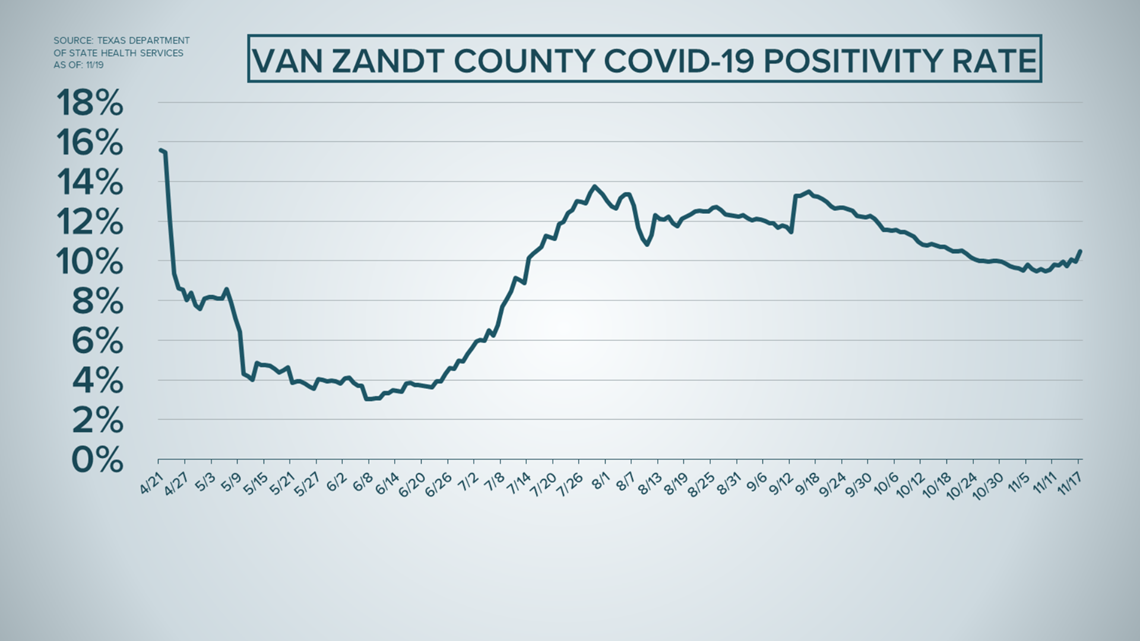
Van Zandt County
Van Zandt County currently has a positivity rate of 11%. The record-high happened on April 21 at 16%.
The county's current seven-day average positivity rate is 10%. The record happened from Sept. 13–19 when the average was 13%.

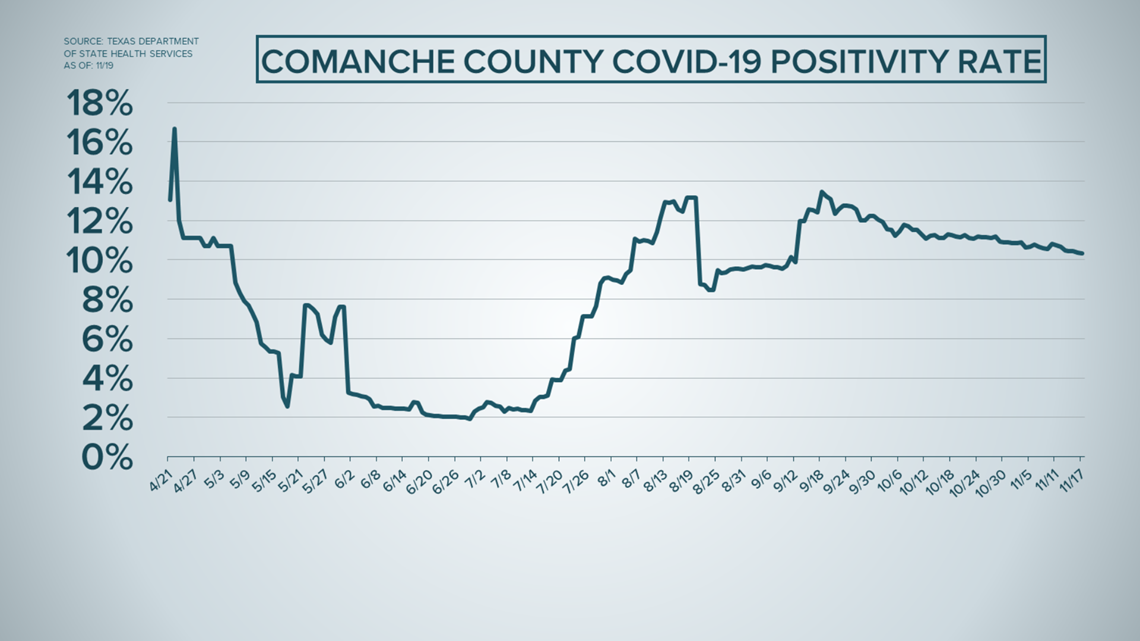
Comanche County
Comanche County currently has a positivity rate of 10%. The record-high happened on April 22 at 17%.
The county's current seven-day average positivity rate is 11%. The record happened from Aug. 14–20 when the average was 13%.

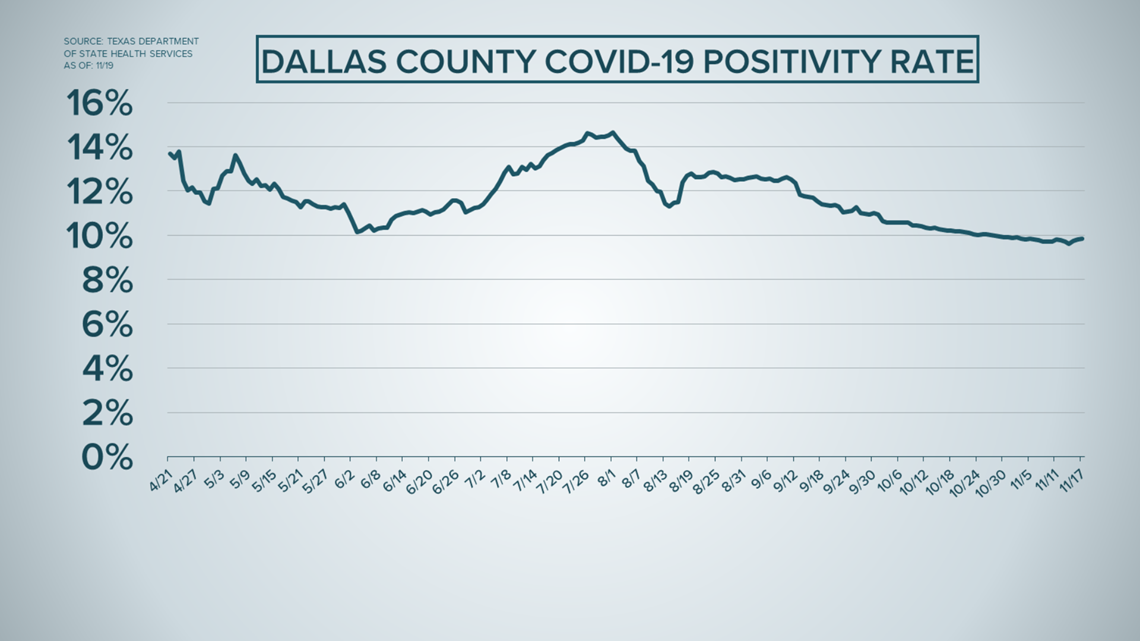
Dallas County
Dallas County currently has a positivity rate of 10%. The record-high happened on Aug. 1 at 15%.
The county's current seven-day average positivity rate is 10%. The record happened from July 26 to Aug. 1 when the average was 15%.

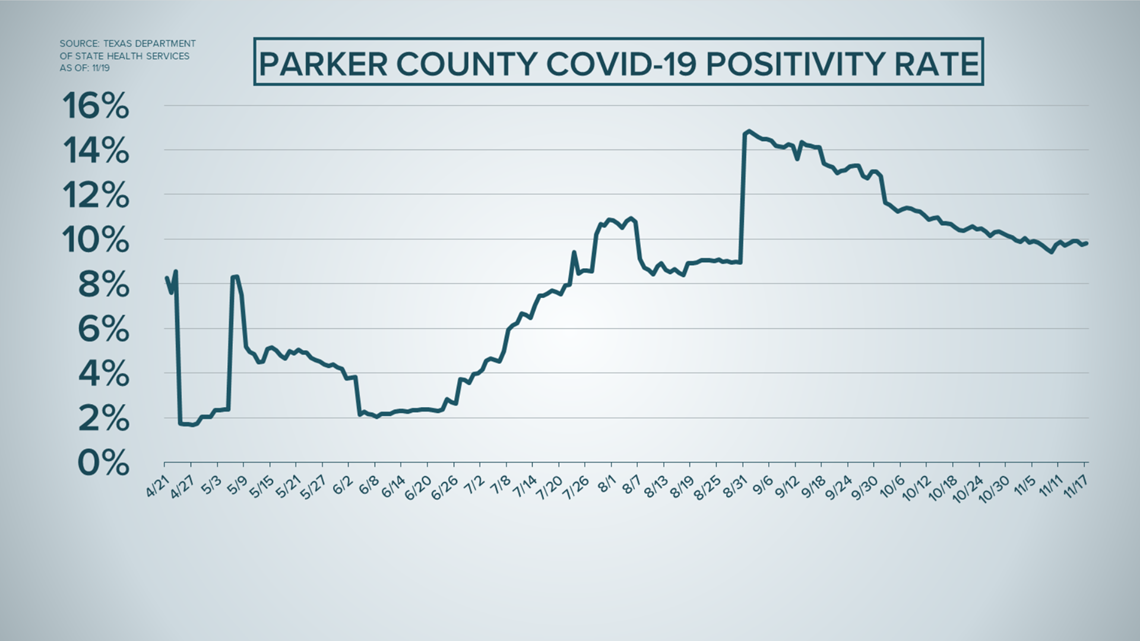
Parker County
Parker County currently has a positivity rate of 10%. The record-high happened on Sept. 1 at 15%.
The county's current seven-day average positivity rate is 10%. The record happened from Aug. 31 to Sept. 6 when the average was 15%.

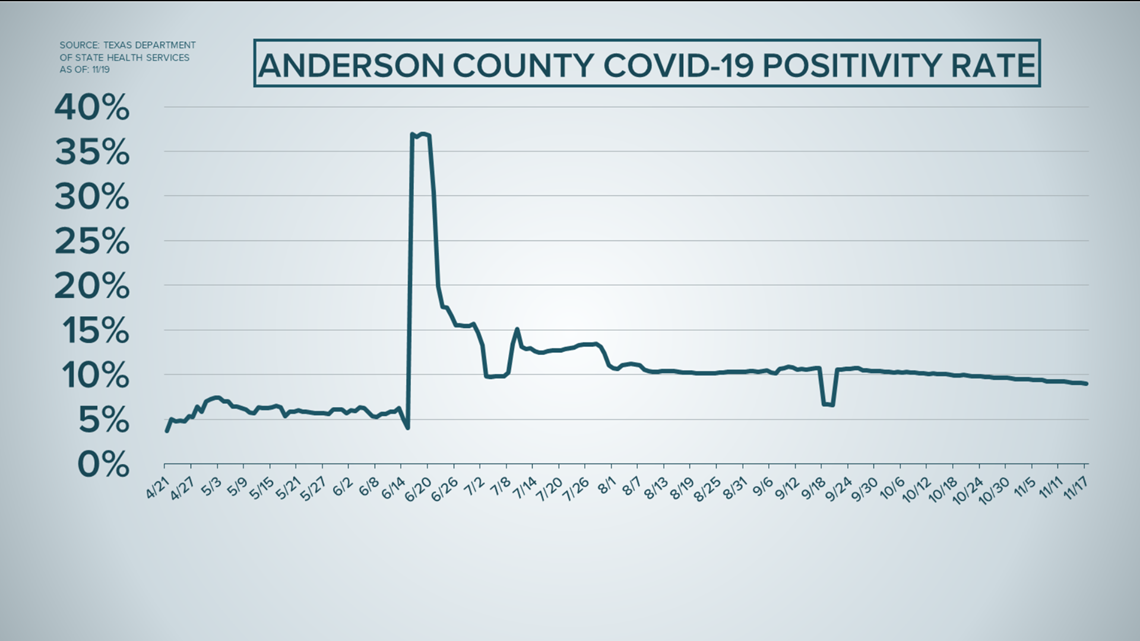
Anderson County
Anderson County currently has a positivity rate of 9%. The record-high happened on June 19 at 37%. This is in large part due to a data dump of 887 new COVID-19 cases that happened on June 16.
The county's current seven-day average positivity rate is 9%. The record happened from June 16–22 when the average was 34%.

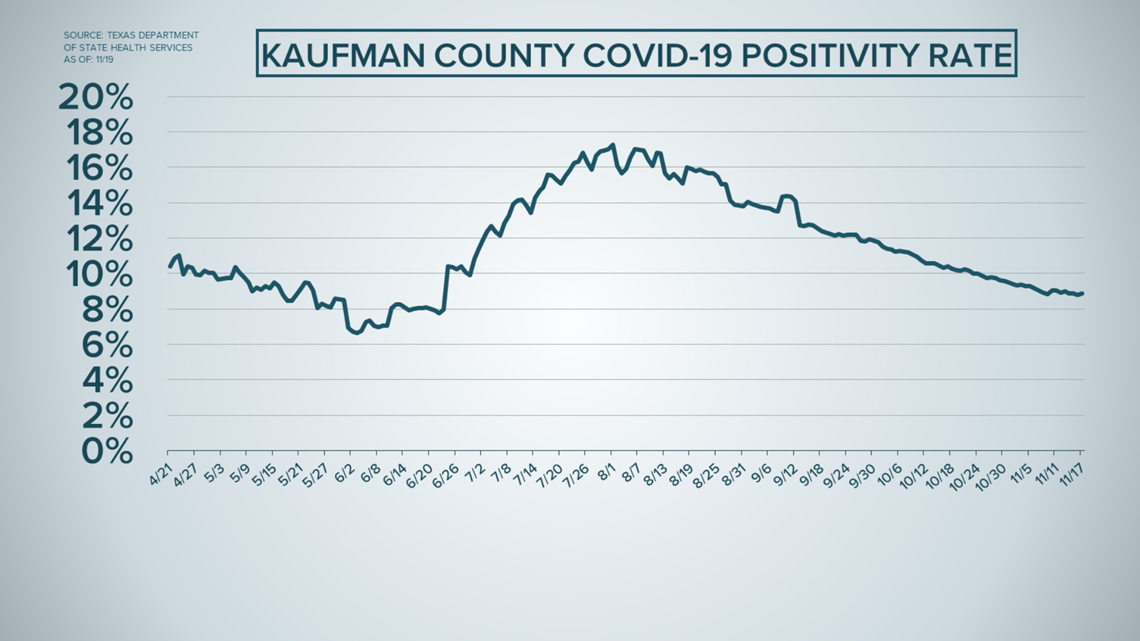
Kaufman County
Kaufman County currently has a positivity rate of 9%. The record-high happened on Aug. 1 at 17%.
The county's current seven-day average positivity rate is 9%. The record happened from Aug. 6–12 when the average was 17%.

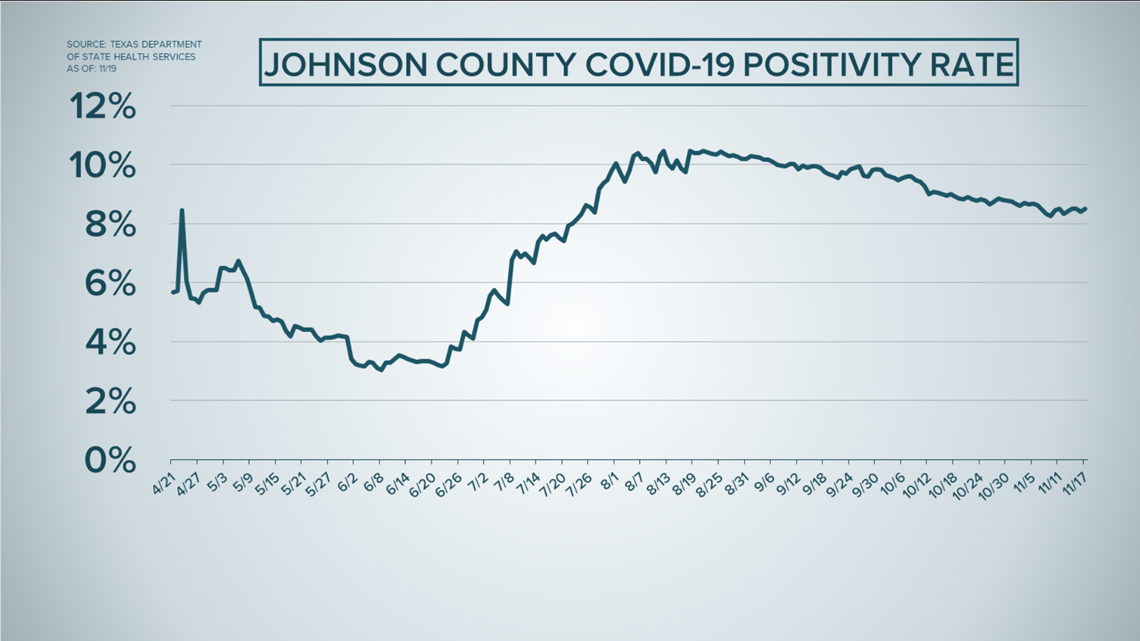
Johnson County
Johnson County currently has a positivity rate of 9%. The record-high happened on Aug. 12 at 11%.
The county's current seven-day average positivity rate is 8%. The record happened from Aug. 18–24 when the average was 11%.

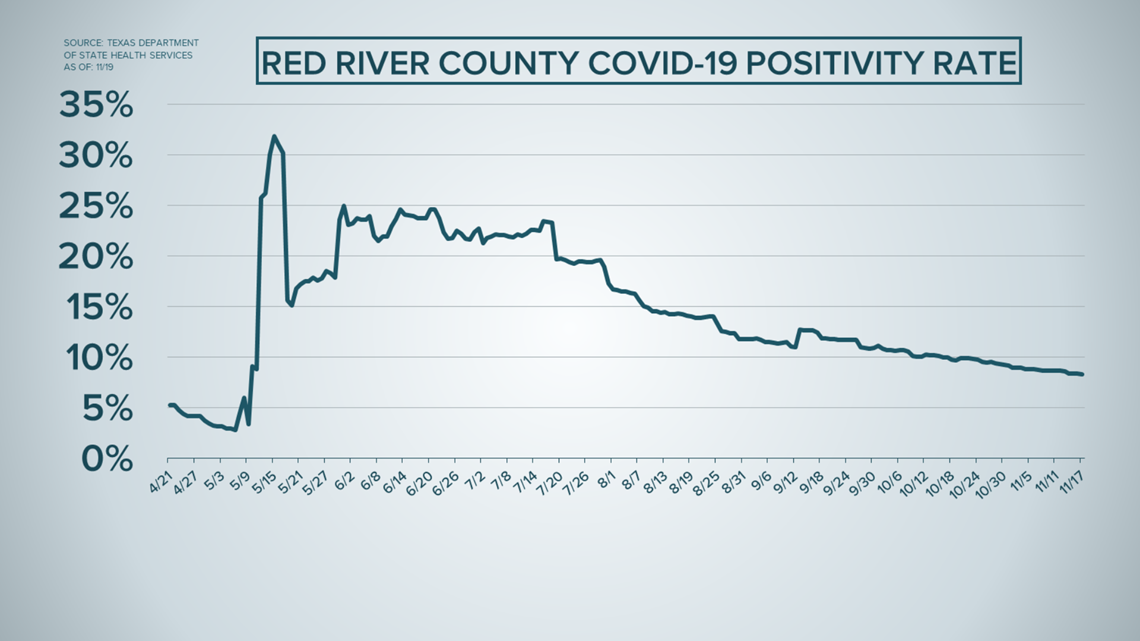
Red River County
Red River County currently has a positivity rate of 8%. The record-high happened on May 15 at 32%.
The county's current seven-day average positivity rate is 9%. The record happened from May 12–18 when the average was 27%.

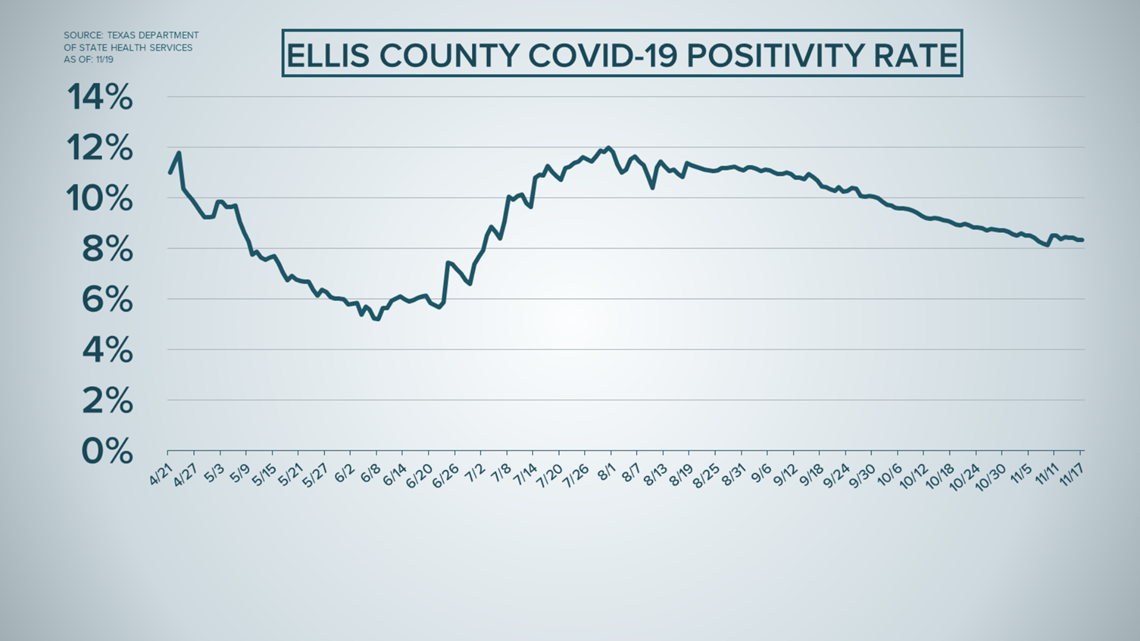
Ellis County
Ellis County currently has a positivity rate of 8%. The record-high happened on July 31 at 12%.
The county's current seven-day average positivity rate is 8%. The record happened from July 26 to Aug. 1 when the average was 12%.

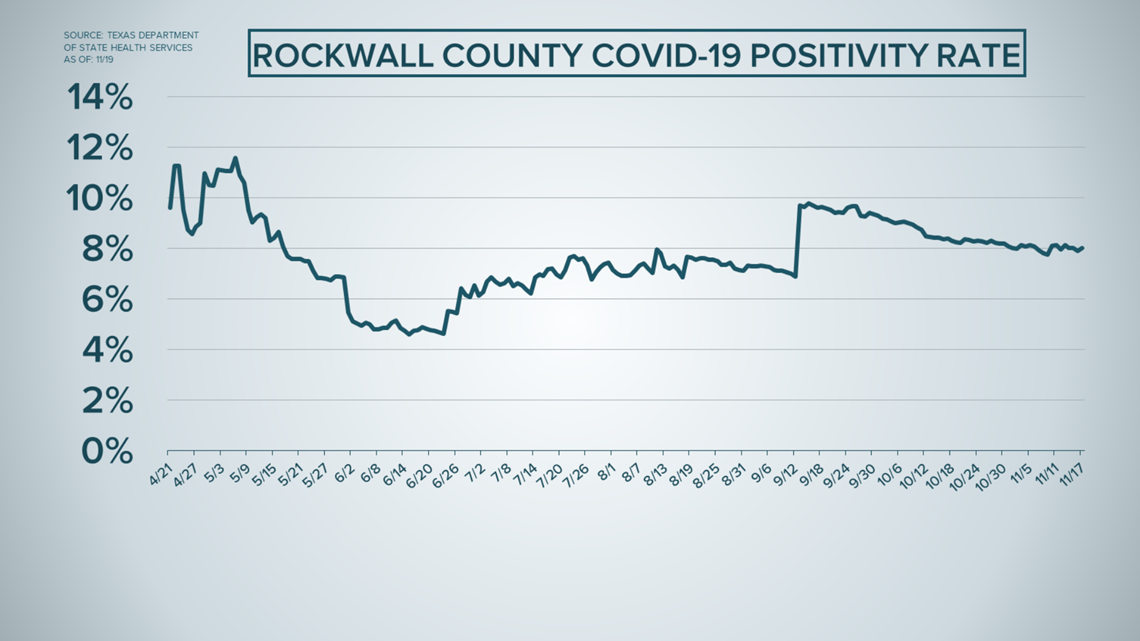
Rockwall County
Rockwall County currently has a positivity rate of 8%. The record-high happened on May 6 at 12%.
The county's current seven-day average positivity rate is 8%. The record happened from April 28 to May 4 when the average was 11%.

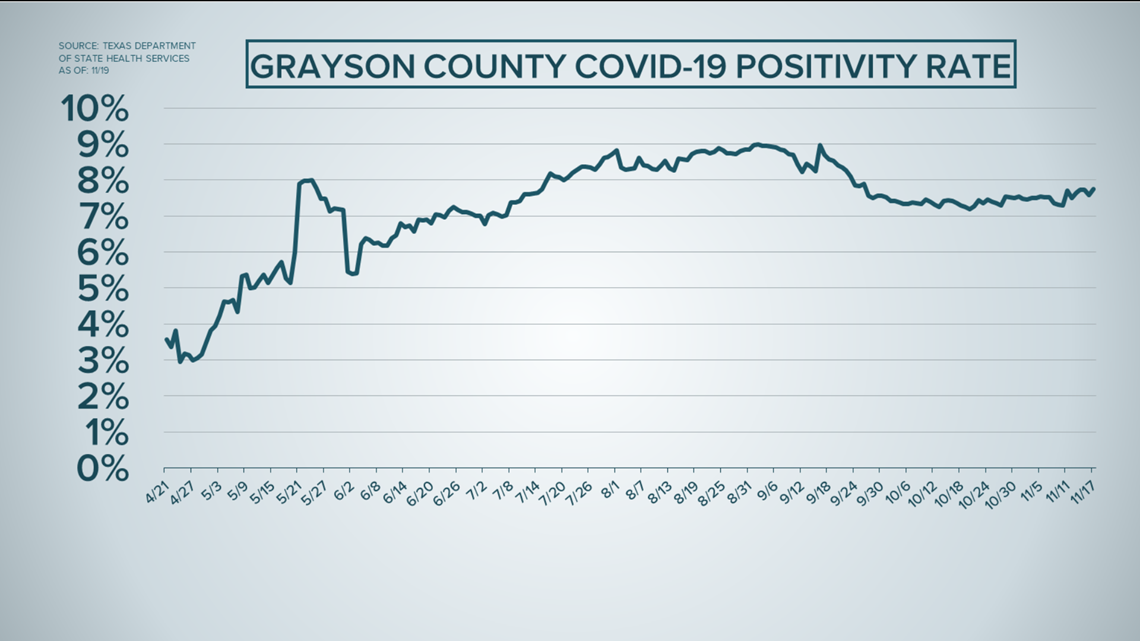
Grayson County
Grayson County currently has a positivity rate of 8%. The record-high happened on Sept. 2 at 9%.
The county's current seven-day average positivity rate is 8%. The record happened from Sept. 1–7 when the average was 9%.

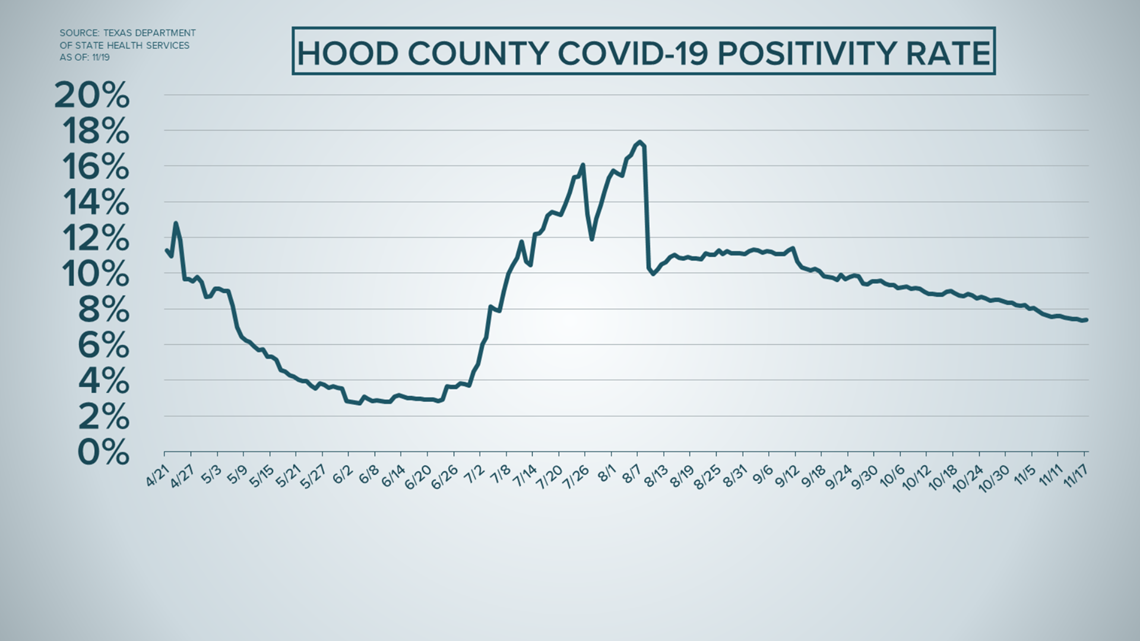
Hood County
Hood County currently has a positivity rate of 7%. The record-high happened on Aug. 7 at 17%.
The county's current seven-day average positivity rate is 7%. The record happened from Aug. 2–8 when the average was 17%.

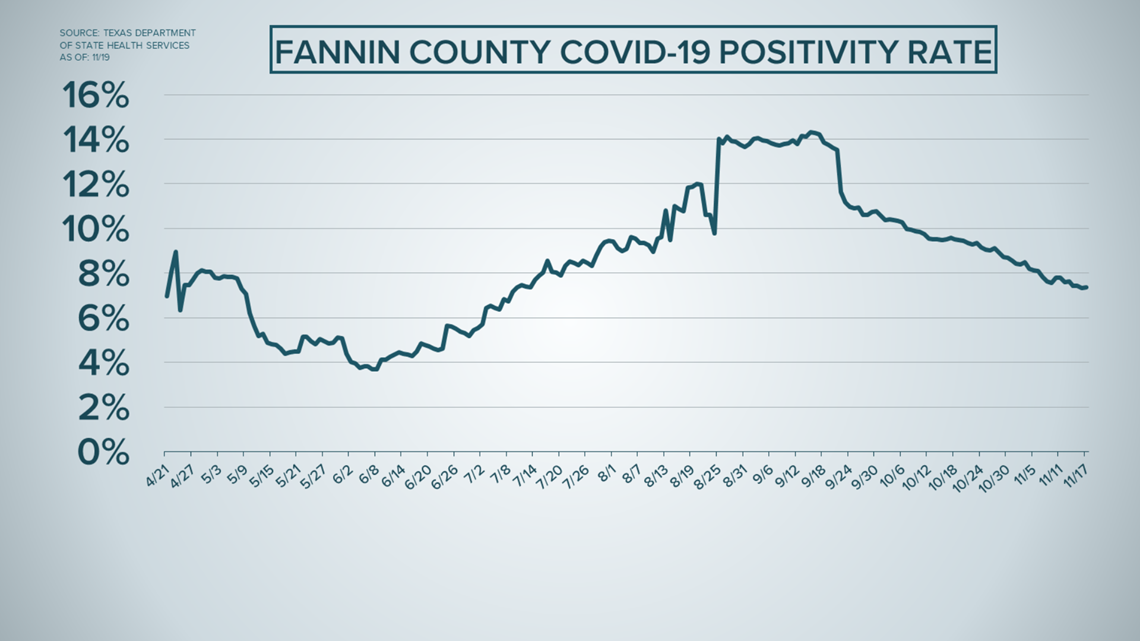
Fannin County
Fannin County currently has a positivity rate of 7%. The record-high happened on Sept. 15 at 14%.
The county's current seven-day average positivity rate is 8%. The record happened from Sept. 11–17 when the average was 14%.

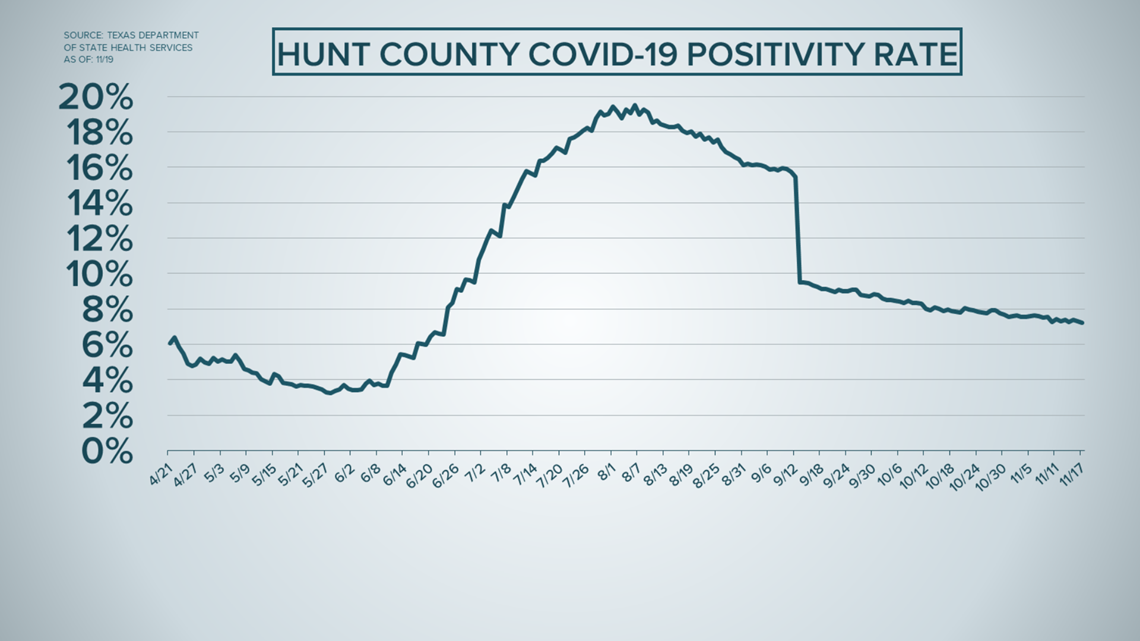
Hunt County
Hunt County currently has a positivity rate of 7%. The record-high happened on Aug. 6 at 20%.
The county's current seven-day average positivity rate is 7%. The record happened from July 31 to Aug. 6 when the average was 20%.

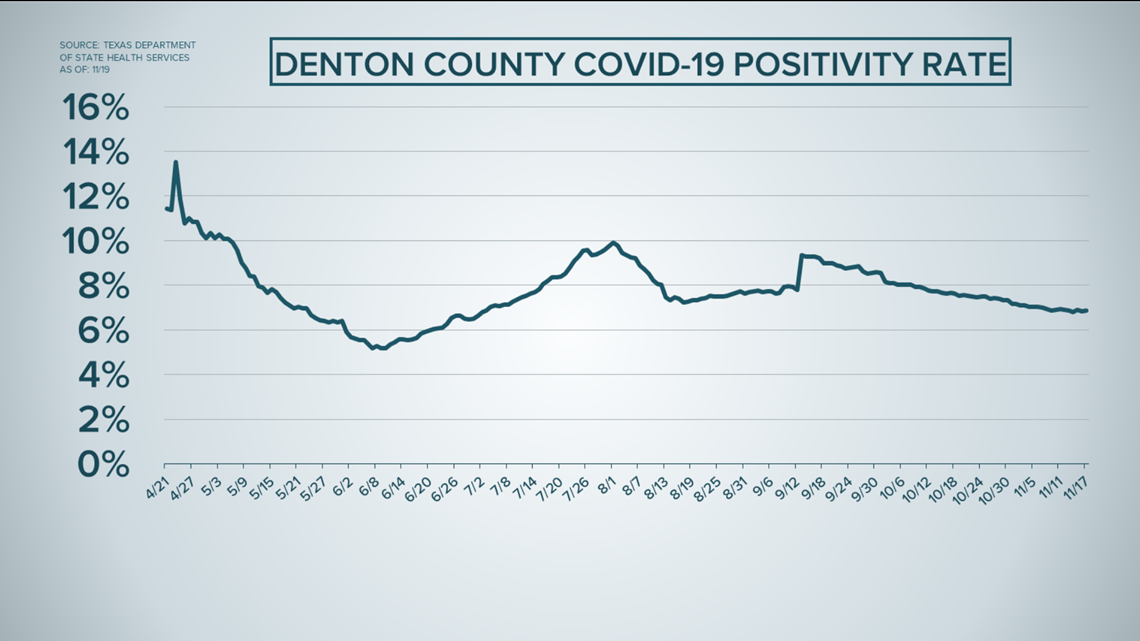
Denton County
Denton County currently has a positivity rate of 7%. The record-high happened on April 23 at 14%.
The county's current seven-day average positivity rate is 7%. The record happened from Apr. 21–27 when the average was 12%.

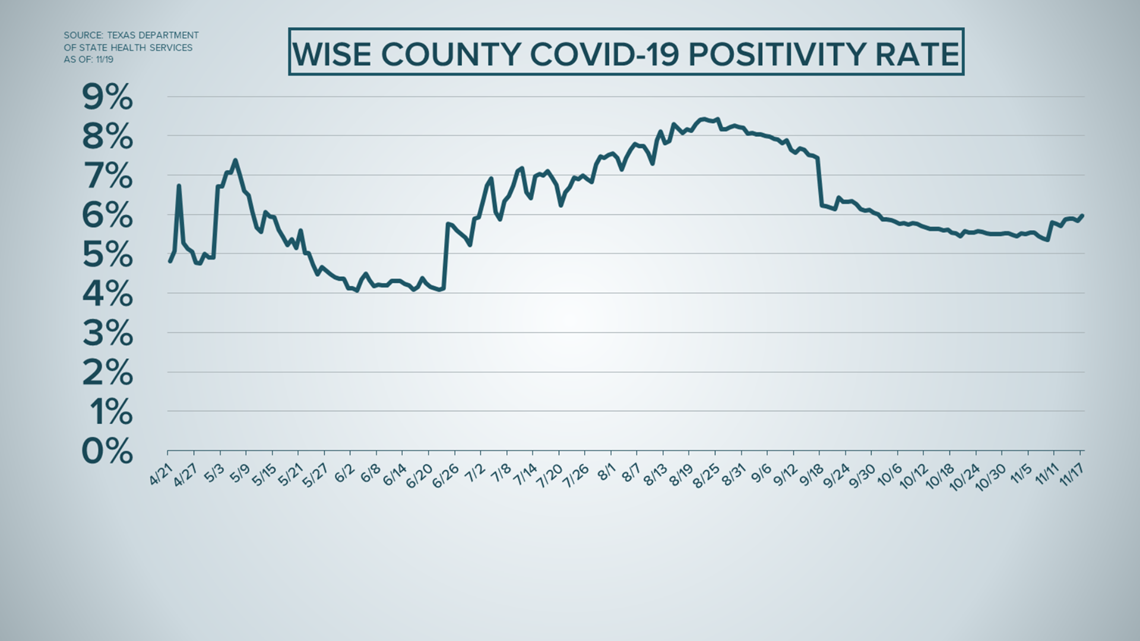
Wise County
Wise County currently has a positivity rate of 6%. The record-high happened on Aug. 22 at 8%.
The county's current seven-day average positivity rate is 6%. The record happened from Aug. 20–26 when the average was 8%.

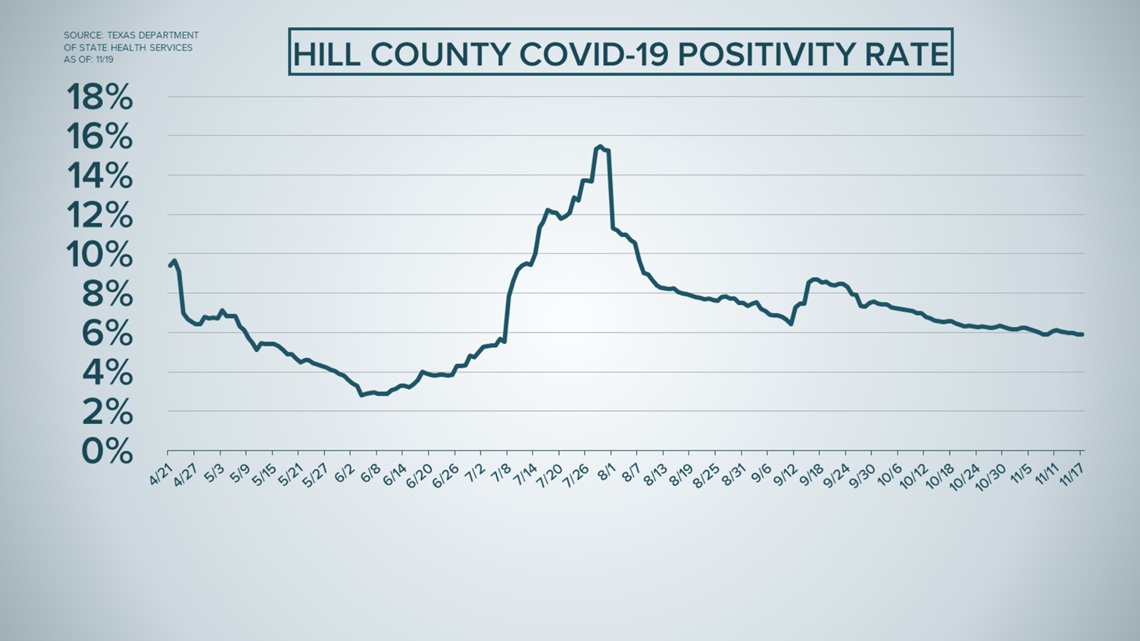
Hill County
Hill County currently has a positivity rate of 6%. The record-high happened on July 29 at 16%.
The county's current seven-day average positivity rate is 6%. The record happened from July 25–31 when the average was 15%.

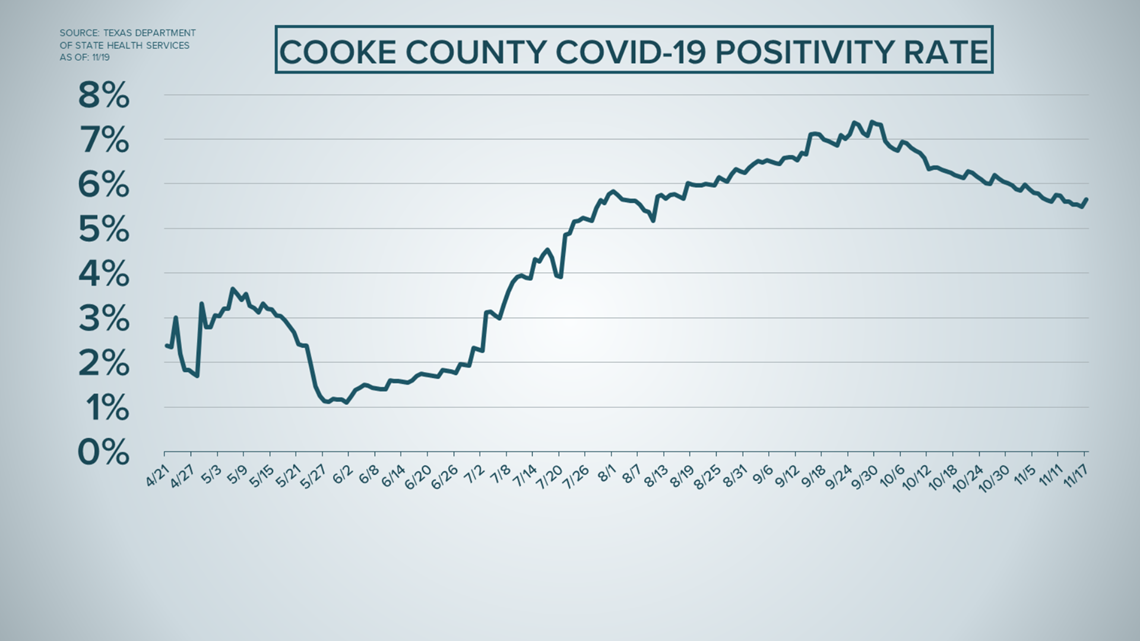
Cooke County
Cooke County currently has a positivity rate of 6%. The record-high happened on Sept. 29 at 7%.
The county's current seven-day average positivity rate is 6%. The record happened from Sept. 25 to Oct. 1 when the average was 7%.

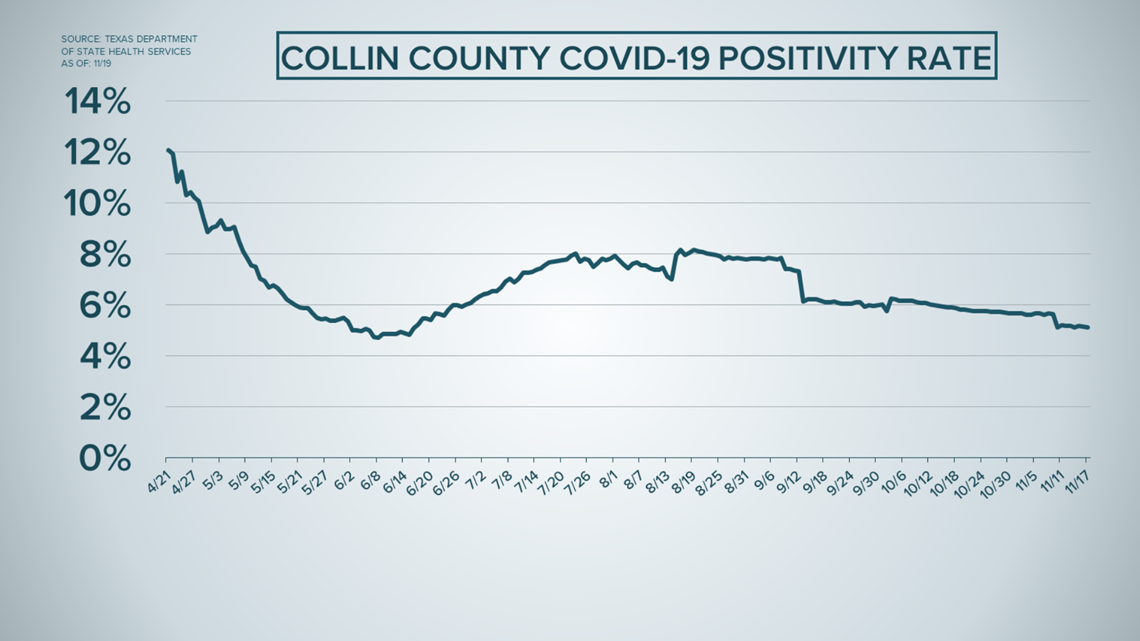
Collin County
Collin County currently has a positivity rate of 5%. The record-high happened on April 21 at 12%.
The county's current seven-day average positivity rate is 5%. The record happened from April 21–27 when the average was 11%.